Version 2.3.1 is the newest version of DataGraph
Download DataGraph for OS X 10.4
Download DataGraph for OS X 10.5
October 25th 2009.
What changed from 2.0.1 to 2.1:
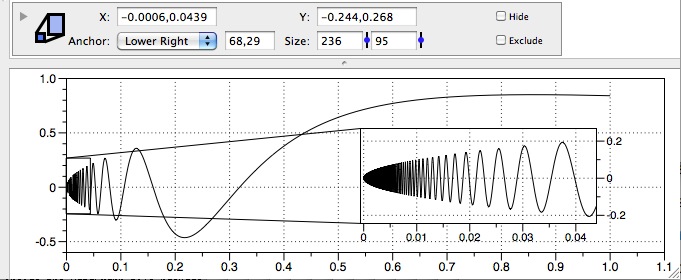
- A new drawing command - Magnify. This is a pretty big improvement, and allows you create a picture in a picture graph where the inset figure is a plot detail. You can drag the source and destination rectangle around interactively. Can also specify if a drawing command should appear in the magnified portion or not. The default is that a drawing command shows up in both the standard and magnified view, but can be set to only show up in one of them.
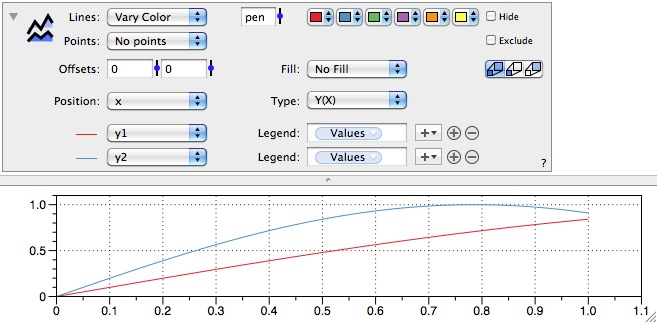
- New drawing command - Plots. This is used when you have a number of (x,y) plots with either a shared x or y coordinate. Instead of creating multiple Plot commands you can use a single Plots command.
- Redid the color selector. Before all colors were specified using the standard color picker. This makes it tedious to keep consistent colors and requires you to drag small color tiles between drawing commands. Instead of the color picker comes a menu.
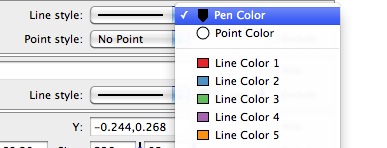
The colors are defined in the style settings. There are 6 line colors, one error color, 6 fill colors and one background color. This could be used as 14 colors but the error and background color are selected by default in some of the commands. For example the error bar uses the error color by default, so you can change them all to black by just changing the error color in the style settings. You can still use the standard color picker since the last entry in the color menu is "Color Picker" which brings up the standard UI.
- Added a new fill style. This is a procedural texture so it will print out in high resolution but uses a bitmap to do it. This is a fractal based noise function (Perlin noise) and is widely used for special effects.
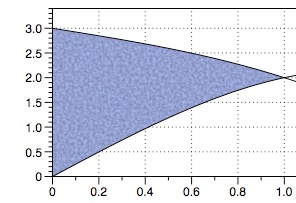
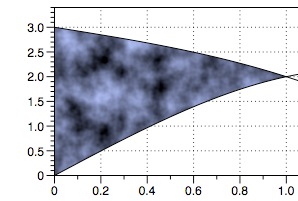
This can be used to create odd effects by using transparency. You can change the foreground/background color and the texture is recomputed on the fly.
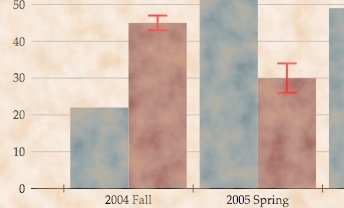
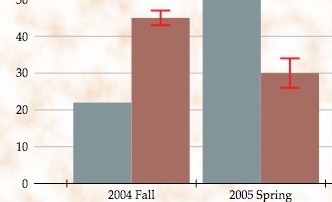
- Improved pdf/eps export. pdf/eps have some limitations, in particular when you are dealing with transparency and gradients. Now the eps and pdf will indicate that the figure will be modified slightly. For example for EPS there is no way to specify transparency, so the colors will be adjusted so they will look the same on a white background but be completely opaque.

PDF can handle transparency (except for semi-transparent gradients) but if you are printing the figure out on a laser printer the raster will not do a good job so you get the option of allowing transparency or not.

- The extra axis can now convert between temperature coordinates. These are not linear scales so they aren't standard unit conversions.

- Beefed up the font style overwrite. You can now remove italic/bold from a font (style overwrite) and also overwrite the color.

- Added logical operators !=, ==, <, >, ≤, ≥, <=, >=, &&, || to the expressions. These functions evaluate logicals using 0 and 1, and can be used in standard expressions, such as 4*(x==1) + 8*(x==2) to be 4 when x is 1 and 8 when x is 2.
- Added mask to the Line command, and added ≠ as one of the match methods to all mask selectors. Can use the new logical expressions to create more complicated masks.
- Added more patterns (a finer version)
- Added logarithmic binning for histograms.
- Can drag columns from the column list onto column selectors. That means that if you see the column you can drag it onto the menu without having to find the column in the menu as well. Also, if you drag a group of columns onto a drawing command or a group of drawing commands you can switch columns from one group to the other. For example assume you have the column x in both group 1 and group 2, but currently a command is using group 1->x. If you drag group 2 onto the drawing command, the x column now is selected from group 2 instead of group 1. This applies to all column selectors in the drawing command. If a selected column name is not found in the group that is dragged onto the command, it is not changed. This is particularly useful when dragging a group of columns onto a group of commands (starting entry in that group). Doing that is the same as dragging the column group onto each command in the drawing group.
- Added support for LinkBack to the Graphic command. Can for example drag an equation from LaTeX-It and then copy it back into LaTeX-It to edit it.
- When creating a new file I no longer automatically paste the content of the clipboard into the data table. So no need to be careful any more to clear the clipboard when creating a new DataGraph file.
- Added two more properties to columns - .rmin and .rmax. minimum and maximum value up to a given row.
- Can drag multiple columns onto a Plots or Bars command to add them to the drawing command.
- Adjusted how multiple lines are drawn in Legend, Text and Color Legend. This will change some existing spacing but is more consistent. It is now also possible to adjust the line spacing.
- Other minor changes and tweaks.