May 4th 2010.
This is no longer the newest version, version 3.0 is the newest.
Note. If you are using a version before 2.2, please look at the release notes for 2.2, since the update 2.1.1->2.2 was a significant update.
This version fixes a crashing error that happened when you paste/import rows into a table. That is, you have a sub-set of rows and import a file or paste in things from the clipboard. There are also a few other improvements.
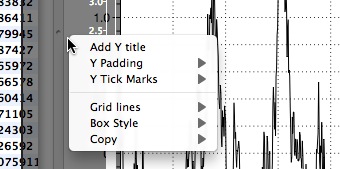
- When the crop floater is visible, a control-click will still work (redirected to the underlying drawing view). This is important since you can use that menu to vary the spacing etc.

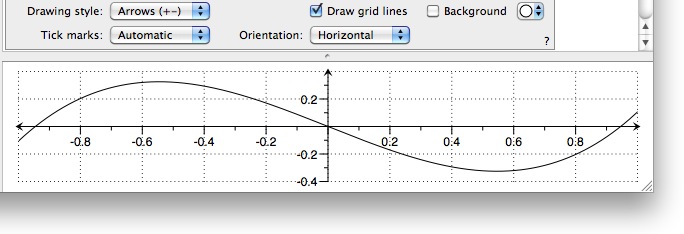
- Added a drawing style to the Extra Axis - Arrow. Draws a small arrow at the start/end of the axis. The arrow will always point away from 0, so if the range is [1,2] there is only an arrow at 2, not If the range is [-1,1] there is an arrow at both ends, and if the range is [-2,-1] the arrow is at -2. You can also choose to only put the arrow at the positive end. In the following graph the x axis has arrows as +- and the y axis only at +.

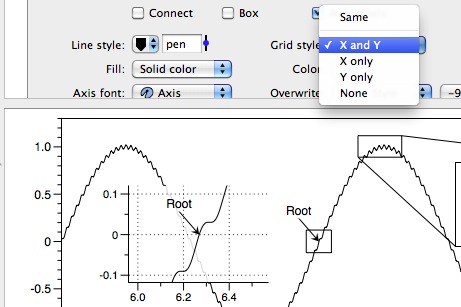
- For the Magnify command, added a "Box" check box that allows you to hide the destination box. Also added an option to overwrite the background grid. The default is the same as the main axis, but you can choose to only draw x, y etc. The grid line style is the same as set in the style settings.

- Fixed an undo error. Dragging a label/graphic/zoom along and undoing would cause a run time exception (no data loss, but annoying).
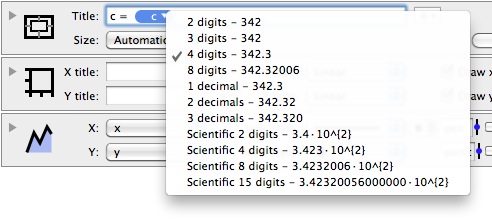
- Added more numerical formats to the token field. Added fixed digits after decimal and scientific notation. The menu shows you a preview based on the actual number.

- Beefed up the display format for the standard column.
- Fixed a svg bug.
- The smooth histogram is now fully optimized and threaded. For a thousand numbers this is not noticeable (a few milliseconds anyway) but when you have tens of thousands or millions it is much more responsive. Speedup is from 4 to 32 from before, and on most machines you should see a 8x speedup.
- For the histogram command, I now explain why the units are a little odd when type==smooth and units=% or Count. http://www.visualdatatools.com/phpBB2/viewtopic.php?p=2326

Since the default unit is Counts this will pop up when you switch to smooth. The warning message will vanish when you click the mouse so it will hopefully only be moderately annoying. The issue is that this option puts a Gaussian pulse (normal distribution) at each sample point and adds the gaussians up. As you vary the width of the Gaussian the peak height gets smaller since the total area stays the same. The Density option is similar, in that for binned values you divide by the width of the bin, so the units are really counts/x unit, and the gaussian can match that if the area of each gaussian is 1. The Probability option means that the total integral is 1. For the standard bins, this means that the count is divided by #*width so the area of the step function is 1. For the Gaussian option each gaussian peak has area 1/# so the total area is 1. One way you can see that is if you set the unit to Density or Probability and switch between a step representation and a smooth representation the value range stays consistent. This means for example that you can overlay them.

When bin size is small, there are fewer entries in each bin so the count will go down. In the above case the bin count was divided by the bin size (0.17) which increased the values. 300 for density means 300 counts/unit.

When bin size = 1, density would divide by 1 anyway so counts and density give the same result.

If both are Density and you vary the gaussian width you still say compatible in units and the distribution picks up more of the underlying details.
