Version 2.3.1 is the newest version of DataGraph
Download DataGraph for OS X 10.4
Download DataGraph for OS X 10.5
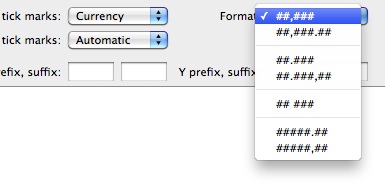
Added more options to the currency format. ## ###, #####.## and #####,##

More forgiving when importing text files that use , as the decimal separator. So 123,456 will be converted to 123.456 when it is imported. Before you had to convert it manually.
If you hold down the command key (apple key) while resizing columns, all of the selected columns are made the same width.
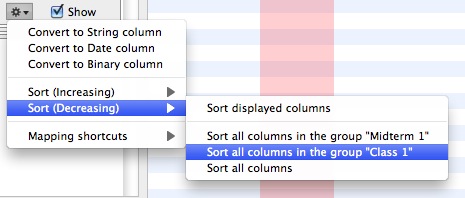
Added a method to sort a particular group only. Before you could either sort all columns or all columns in the same group as the column you selected. Now you can go up to any parent group if you have a lot of nested groups. Useful if you are using the groups for different data sets and want to make sure that you only sort a particular data set. For example

Added a context menu for a particular entry in the table. Using this menu you can add an empty row, remove a row or remove a particular string from a single column.

The column group allows you to break a table into sub-tables and the above entry allows you to act on sub tables independently. The sort routine (context menu for the column) now allows you to apply the sort to each sub-group.
Add tick marks for milliseconds when you zoom in on a date axis.
Added a new display size for canvas - "Actual" which is based on the current screen resolution (dpi). So 4 inches will show up as 4 inches on the screen.
Fixed a label issues for bars http://www.visualdatatools.com/phpBB2/viewtopic.php?t=487
The labels can now be rotated clockwise or counter clockwise.
Can use units such as in, cm in offsets in all commands. You can for example make sure that the legend is exactly 2.3in or 6cm.
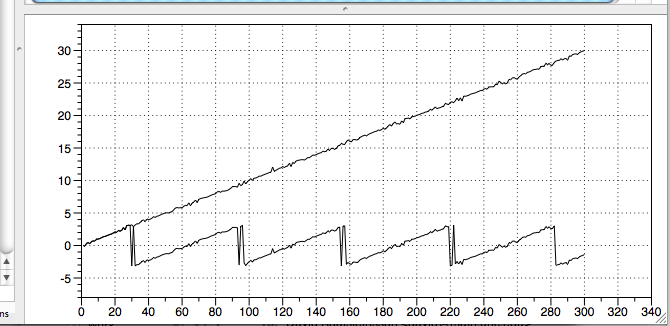
Added three column properties .unwind2π, .unwind360 and .unwind1. The following graph shows two graphs, the lower one is the result of an angle(...,...) call that returns values in the interval -pi,pi. The upper line is using an expression column with the expression y.unwind2π, where y is the column drawn in the lower line. unwind360 and unwind1 are the same except intended for functions with periodicity 360 and 1.
Added more statistics to the histogram command. "s" for sample standard deviation, Q1, Q3 for quartiles and Skewness and Kertosis.
Fixed a few bugs.